
Metrics#
This page turns on and protects the Prometheus endpoint. Next: Laravel for the dashboard.
Metrics are off by default (the stack's metrics rule). With ROLLCALL_METRICS_ENABLED=true, /metrics serves
Prometheus text built from the latest snapshot (a request never triggers a scan). It needs ROLLCALL_METRICS_TOKEN as a bearer token or an address in
ROLLCALL_METRICS_ALLOW; with neither set, nobody gets in. Labels are version numbers, state names, drift kinds and
public package names: no app names or personal data. The dashboard JSON is in grafana/rollcall-burn-down.json; import
it into Grafana once a Prometheus server scrapes the endpoint. Run rollcall scan
on a schedule so the series moves.
Forced image upgrades from a Citadel export come through as three gauges, counts only, in the same style as the
rest: rollcall_forced_upgrades_pending_apps (apps with one pending, overdue ones included),
rollcall_forced_upgrades_overdue_apps (due today or earlier) and
rollcall_forced_upgrades_next_due_timestamp_seconds (midnight of the next date still ahead, only while there is
one). With any other image source the two counts are 0 and the date is absent. The dashboard shows pending and
overdue as two stat panels.
PROCTOR's MySQL 5.6 CI job check comes through as one gauge, rollcall_mysql56_ci_apps, counted per state (held,
missing, not_applicable, unknown); all four series always exist, zero when no app is in a state. The
dashboard shows the four as a bar gauge.
Booster's hop records come through the same way, as rollcall_booster_apps, counted per result (pass, fail,
none); all three series always exist. The dashboard shows the three as a pie chart beside the MySQL 5.6 one.
Every query on the dashboard names a metric this endpoint serves; composer ci renders the fixture fleet's metrics
and fails when a panel asks for one that is not there, so a renamed gauge never leaves a panel on "No data".
Watch the back row empty (the burn-down, sample data)
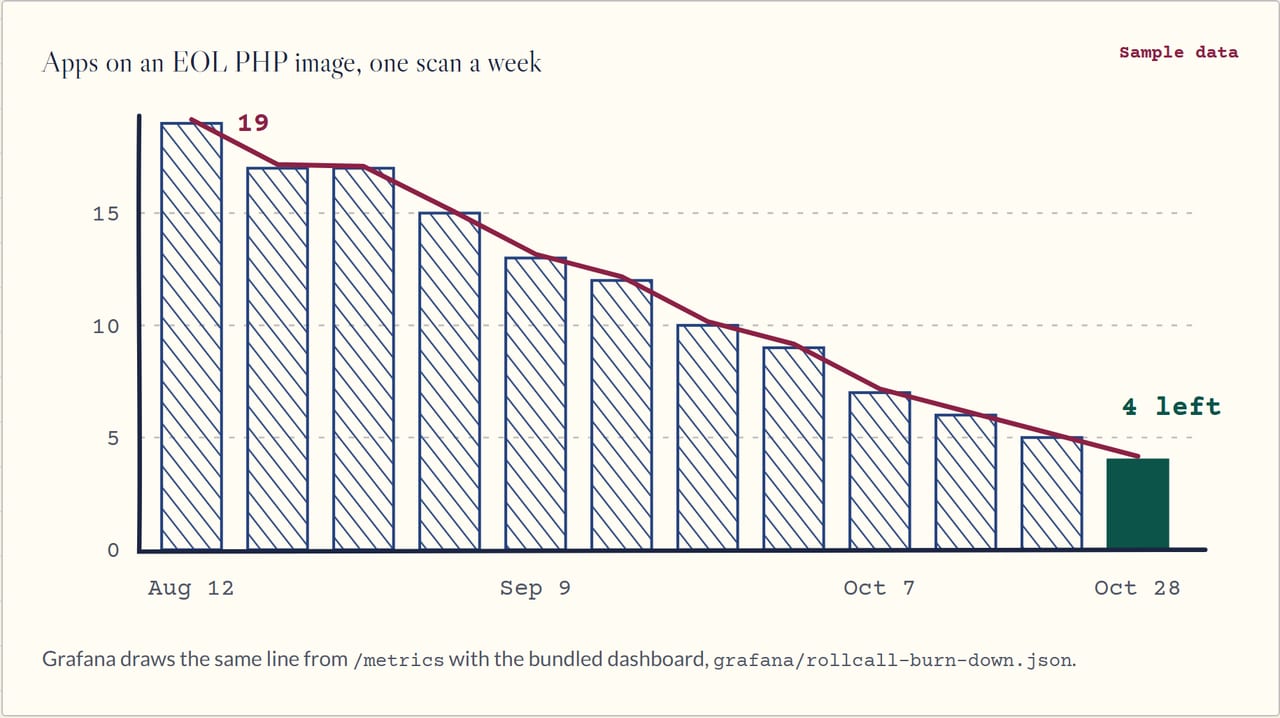
The same line Grafana draws from /metrics. Made-up apps, real arithmetic.